Who Would be the Next President if Children Could Vote?
This week Donald Trump was elected to be the 45th President of the United States. The minimum voting age in the U.S. is 18…but what if it was 5?
Over the last week, thirty-seven K-12 schools from all over the United States used our platform, Election Runner, to run mock presidential elections. Election Runner makes it incredibly easy (like, ridiculously easy) for schools/organizations to build secure and fair elections. Voting is even easier and can be done on any device that can connect to the internet (read: every device).
Many schools decided to run a mock presidential election to help their students understand why we vote and how it works. While their votes won’t count the same as their parent’s vote, it’s still important for them to learn how to exercise their constitutional right to party vote and that their ballot does in-fact count in some way. So we decided to have some fun with the results to see how the presidential election would have played out if only children were voting.
The Popular Vote
While the popular vote doesn’t decide the actual winner of the election, it’s still a very good indicator as to how the electoral college math will play out.
Here’s the results from over 14,000 children…
And this is how it compared to the actual popular vote…
| Candidate | Students % | Actual % |
|---|---|---|
| Hilary Clinton | 61.04% | 47.70% |
| Donald Trump | 30.63% | 47.50% |
| Gary Johnson | 6.03% | 3.23% |
| Jill Stein | 2.28% | 1.57% |
| * As of November 10th, 10:00 am CST | ||
The Electoral College
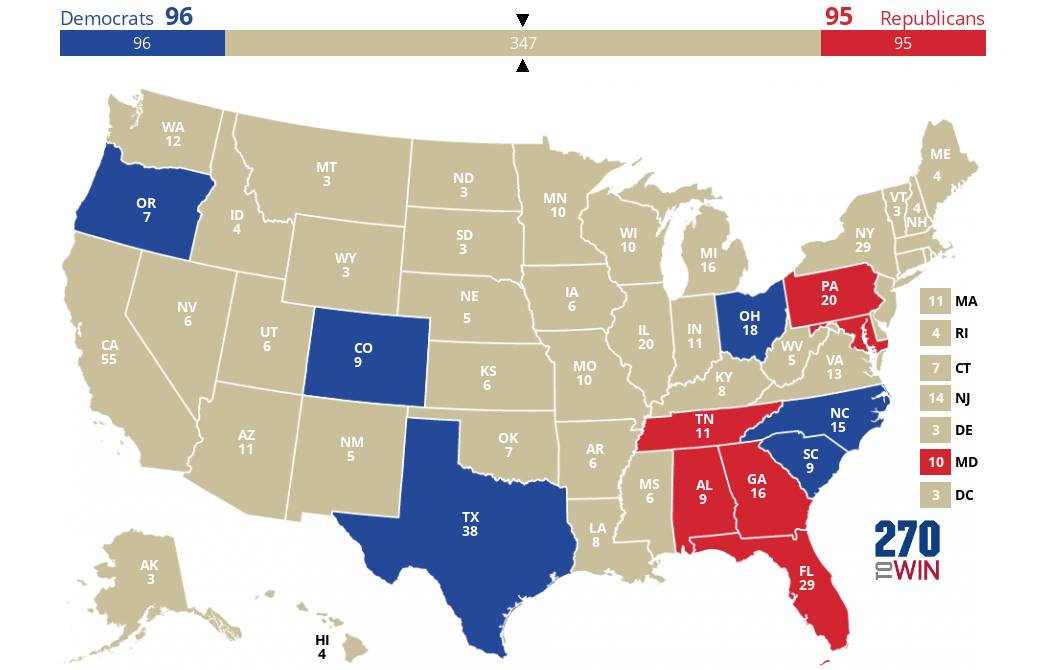
There were a total of 12 states that participated in the mock elections. Making up for 191 total possible electoral votes. In the real election, 270 will get your candidate in the white house, but 96 will do it here.
| State | Clinton % | Trump % | Electoral Votes | Winner | Actual |
|---|---|---|---|---|---|
| Texas | 68.41% | 21.59% | 38 | Clinton | Trump |
| Florida | 45.04% | 46.36% | 29 | Trump | Trump |
| Pennsylvania | 36.92% | 56.7% | 20 | Trump | Trump |
| Ohio | 65.27% | 22.63% | 18 | Clinton | Trump |
| Georgia | 39.51% | 48.78% | 16 | Trump | Trump |
| North Carolina | 63.65% | 26.94% | 15 | Clinton | Trump |
| Tennessee | 25.94% | 74.06% | 11 | Trump | Trump |
| Maryland | 48.24% | 51.76% | 10 | Trump | Clinton |
| Alabama | 12.57% | 87.43% | 9 | Trump | Trump |
| South Carolina | 72.57% | 27.43% | 9 | Clinton | Trump |
| Colorado | 81.17% | 16.35% | 9 | Clinton | Clinton |
| Oregon | 74.71% | 20.85% | 7 | Clinton | Clinton |
And here’s how it looks on the electoral map.
Results by School Level
Here’s what it looks like if we break the results down by school level.
| School Type | Hilary Clinton | Donald Trump |
|---|---|---|
| Elementary School | 43.71% | 55.16% |
| Middle School | 52.83% | 44.50% |
| High School | 60.17% | 34.77% |
Takeaways
Although this is far from being scientific, it appears that if children could vote, they would have elected Hilary Clinton as the 45th President of the United States.